There are a lot of things to consider when handling an e-Commerce website – from creating an overall strategy, to building high quality back links. Part of the overall strategy is to know which pages perform well and which do not. Reason is let’s say you have thousands of pages (which is usual to e-commerce websites) and you need to figure out your top 100 pages that perform best, you will definitely need this report.
As part of our process in Spiralytics, we create this report and use it for AdWords targeting. It also helps us figure out what pages we should put most of our SEO efforts into.
Using data in Google Analytics and having a basic knowledge on Excel, I’ll help you determine which category pages perform well in your website. Let’s start!
Tools needed:
- Excel
- Google Analytics
List all your website’s top level categories. Since we’re going to use VLOOKUP later, the values should be the same as the parsed URL of the category pages.
Example: http://www.website.com/category-1/sub-category-1/product-1.html
In this case “category-1” is the category
The thing we need to look at is the total page value of each category. Note that I’m not talking about the category page itself only, but the pages within the category as well. The reasons why I want to see the page value of each category are as follows:
– to know what products people are interested in
– to see what they usually search for
– to know if a specific category generates good revenue on a certain date. This way, I would know what to sell on that certain date/season and when I should put all my promotional and SEO efforts.
Now login to your Google Analytics account and pull out your website’s page value data. You can always choose the date you want to analyze. I suggest you pull out 6 months to 1 year of historical data (Month/Month) and start from there.
1. Copy the Page column and paste it at the end. Select that whole Page column.
2. Hover to the Menu bar and click Data then choose Text to Columns.
3. Click Next then choose Others: then input one forward slash “/”.
4. Click Next then Finish.
Now we need to get the Weighted Average of each category. Add another column called Helpers.
5. On the Helpers column, multiply Unique Pageviews with Page Value.
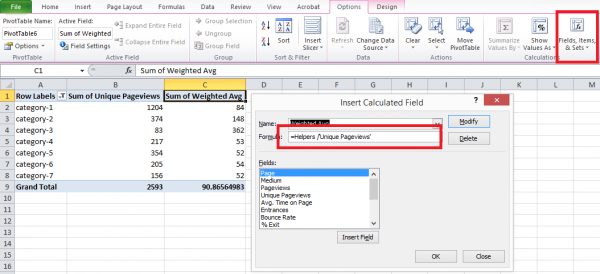
6. Use Pivot Table to get the weighted average. Include “Category” and the sum of “Unique Pageviews” on the table.
7. Choose Options on the PivotTable Tools then select “Fields, Items, & Sets”.
8. Add a field and name it “Weighted Avg” then use this formula: =Helpers/’Unique Pageviews’.
9. Click OK then you’ll get this data (see below).
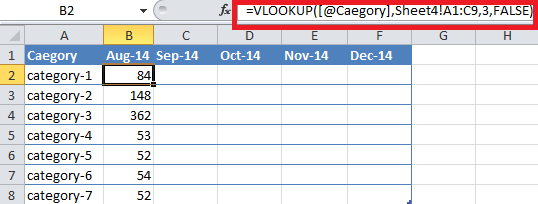
10. Finally, use VLOOKUP to get the accurate data of each category.
Do this weekly and monthly (on a separate tab) to see the traffic trend. I also recommend adding graphs to help your client understand the trend easier.
Now that you have an idea on what pages are valuable, it’s time to prioritize!
On the example above, you can see that the category “gifts” increased its value in December. Meaning, people love buying gifts during this time of the year and selling more products on the “gifts” category is the right thing to do. It’s an opportunity you wouldn’t want to miss.
I‘ve only shown you how to figure out what Category pages perform best but you can always repeat the process (starting on #6) to see the Product pages’ performance. As of now, we’re figuring out the easier way to do this report in Google Analytics. They have this feature called Content Grouping which what we think can definitely help. After we successfully implement it, I’ll write a guide about it too so watch out for that. Let me know what you guys think.
Need help growing your online store? Learn about our bespoke e-commerce services today!


