You create a well-strategized content marketing campaign with some fancy design, and it feels like you are on the right track. You expect your conversions to go through the roof, but time passes and you’re not seeing the numbers you anticipated. So what can you do to generate more traffic via your content marketing campaigns?
Usually, the problem is not about the content you present, but how you present it. There could be several reasons why your campaign didn’t end up how you planned, but one of the main culprits of underperforming content is poor blog user experience.
Sometimes, even if your article is eloquently written and expertly researched, the user experience of your blog post hinders the reader’s engagement.
In this article, we’ll talk about how you can further finetune your content marketing campaign using website analytics tools and heatmaps.
Let’s talk about heatmaps
One of the biggest challenges as a content marketer is convincing visitors to read your pages from start to finish. A lot of the time, readers exit the page as they reach a certain part of the article. You might think, “How good it would be to have a tool that can show how users interact with our campaign.” Well, we have some good news for you!
Website analytics has been developing at a tremendous pace recently, and various analytics tools have been made to understand user behavior and interactions better. Today we are going to learn more about one of the most popular one, which is website heatmap.
What is a website heatmap?
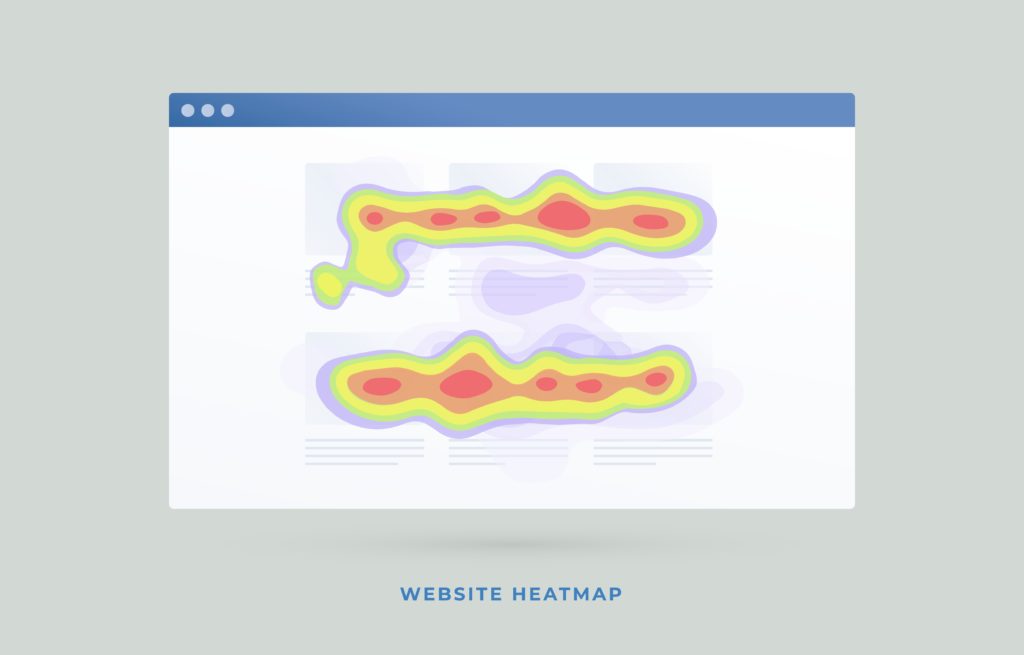
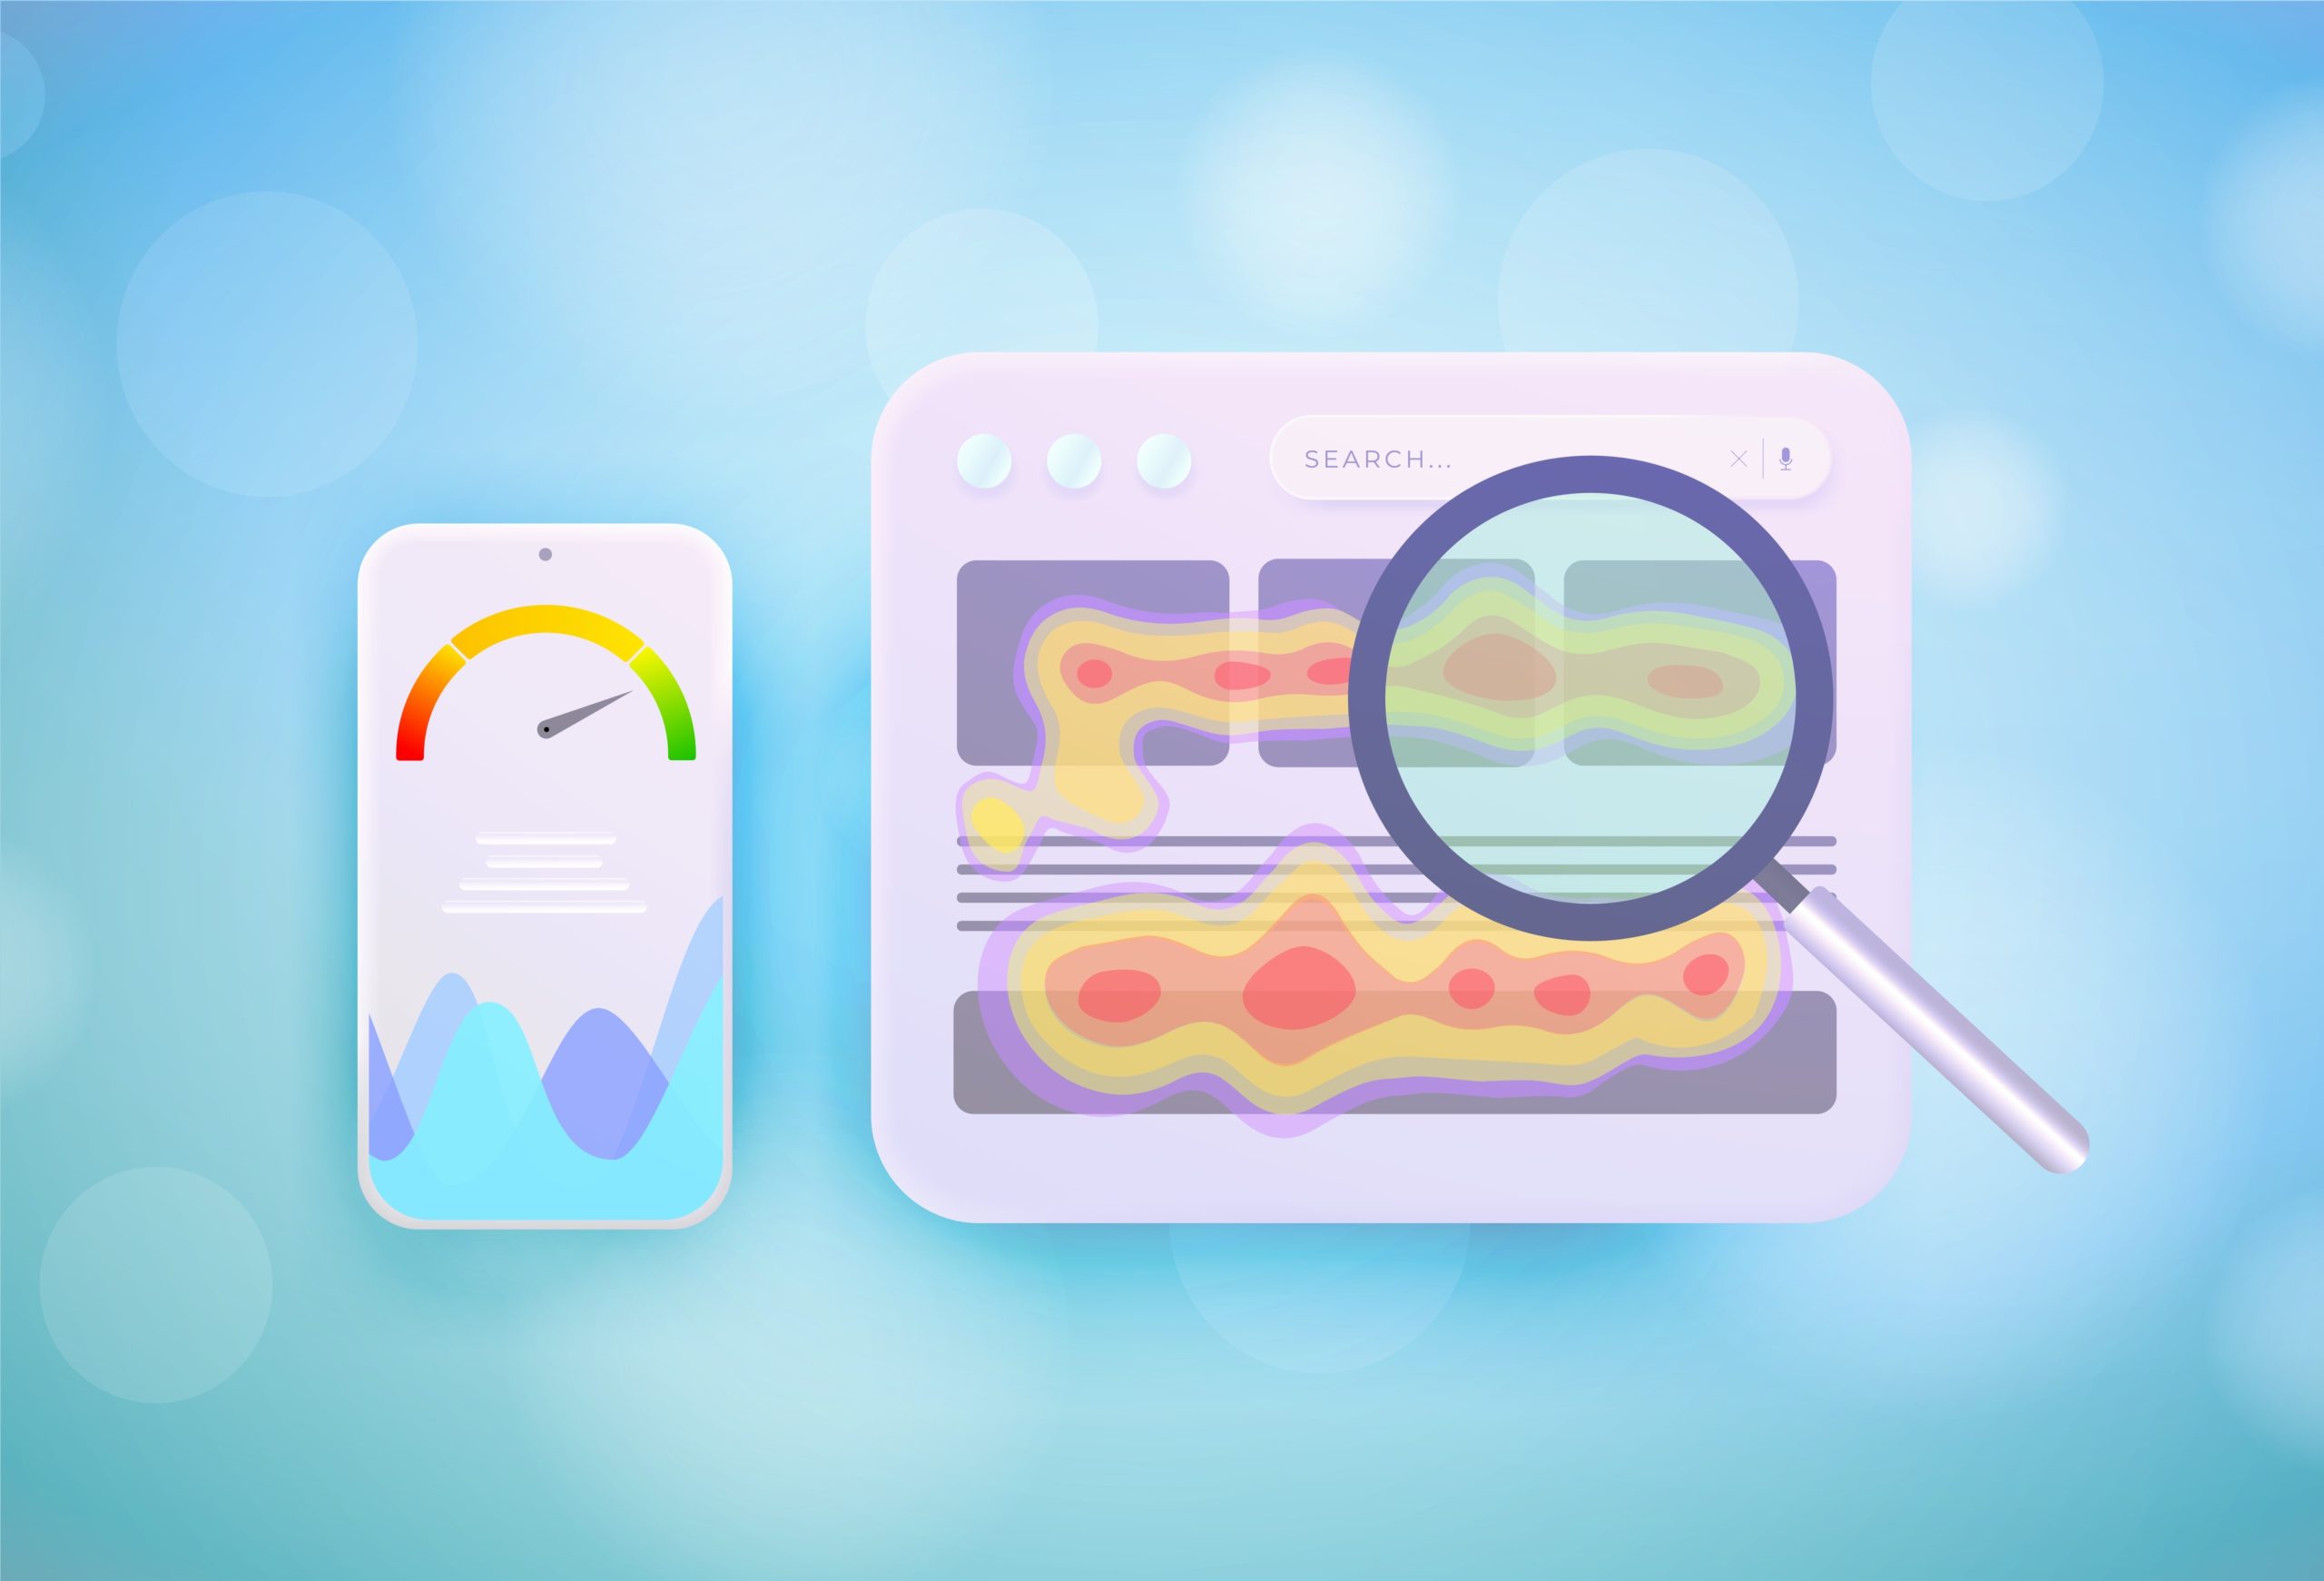
A heatmap is a qualitative analytics tool that visually represents how users interact with your web pages. It uses a temperature scale where “warm” colors refer to the most frequently used part of your website, while “cold” colors indicate the ignored ones.
Depending on what type of heatmap you use, you can collect and analyze different data of your visitors:
- Click heatmaps highlight where users click around your page. The colors are complemented with numbers to give you a clearer picture of the click frequency of each hotspot.
- Scroll heatmaps put the whole temperature scheme on your web pages and reveal how deeply visitors dive into your content. There are checkpoints at significant color changes where you can see the percentages of people that reached that certain point so you can see how intriguing your content is.
- Segment heatmaps are similar to click heatmaps, except these use different colors to show the various sources where users come from before visiting your website. It’s useful to make device- or source-specific assumptions and strategize your campaign interface-wise.
3 Advantages of Content Heatmaps
Heatmaps can be a game-changing tool when you are planning your next content marketing campaign. They reveal weak spots you might have never noticed before and give you a clear picture of how your customers interact on your website. Let’s see how this powerful tool can help in your content marketing campaign!
1. Gather quintessential data
Performance and analytics data from previous campaigns provide a good starting point when you’re planning a new one. You can either make a few “samples” with the same features you would do normally or test a few of your current pages. Generate heatmaps from these pages, so you know which sections you can retain and which ones need revamping.
2. Analyze available statistics
Once you have gathered enough data, it’s time for some analysis! As I mentioned earlier, different heatmaps can reveal different pain points in your marketing campaign:
- Click heatmaps show the least engaging areas of your content. With this type of heatmap, you can also identify unexpected clicks, thus revealing if there are any distracting or confusing elements on the page. Rage clicks or repeated clicks on a specific area tell you that the button isn’t working or the link is broken. You’ll also find out if your CTAs (call-to-actions) achieve their goals since you can see how many clicks they got.
- Scroll heatmap is a tool that focuses more on user engagement. You can have an in-depth look at how far potential customers go when reading your content. You can identify if they scroll down enough to get to the main point of your article or if they leave too early. If a certain part of the page is blue or cold, then you may need to rework that area to make it more enticing to the reader. This gets rid of barriers that hinder the user from reaching the CTA at the bottom of the page.
- Segment heatmaps are great for analyzing how users interact on your website from different devices and platforms. Each source has its own color, so it’s easy to differentiate them. If you’re looking to improve your site’s mobile performance, for instance, this type of heatmap will show you the common frustrations mobile users have when visiting your website.
3. Plan, execute, and monitor

With all the data in your access, the next step is to plan and execute! Consider all the information you have gathered, identify the pain points in your content, and devise solutions for these problems when creating your strategy. You have everything not just to create, but also present content in the best way possible for your audience.
But watch out! Making well-adjusted content doesn’t mean the journey ends here! Though you optimized your campaign for your visitors, it doesn’t mean everything is sorted out forever.
You have to monitor your campaign’s performance constantly. User behavior always changes, so if you want to keep up with the trends and want to retain your conversion, you will always have to make adjustments.
Seasonality is also an important factor to take into account. You can use a screenshot tool to capture changes in user behavior throughout the year. This will also help with data presentation later, as you can highlight important parts immediately and write down notes. Analyze your website heatmaps periodically and apply the necessary adjustments, so you can be sure that your content marketing campaigns are always delivering results.
Win More Customers with Website Heatmaps
Heatmaps are simple yet extremely useful tools that can make your good content even better. With heatmaps, you can gather insightful, actionable data that ensure that your content marketing campaigns effectively engage, attract, convert, and delight your customers.
Supercharge your content marketing services in the Philippines with Spiralytics. Dominate your industry with our expert services.


